
OrgTracer
Visualize automations in execution order, trace permissions, analyze debug logs, audit security posture, and score your org's Agentforce readiness — all running locally in your browser.
Built for Salesforce Admins & Developers
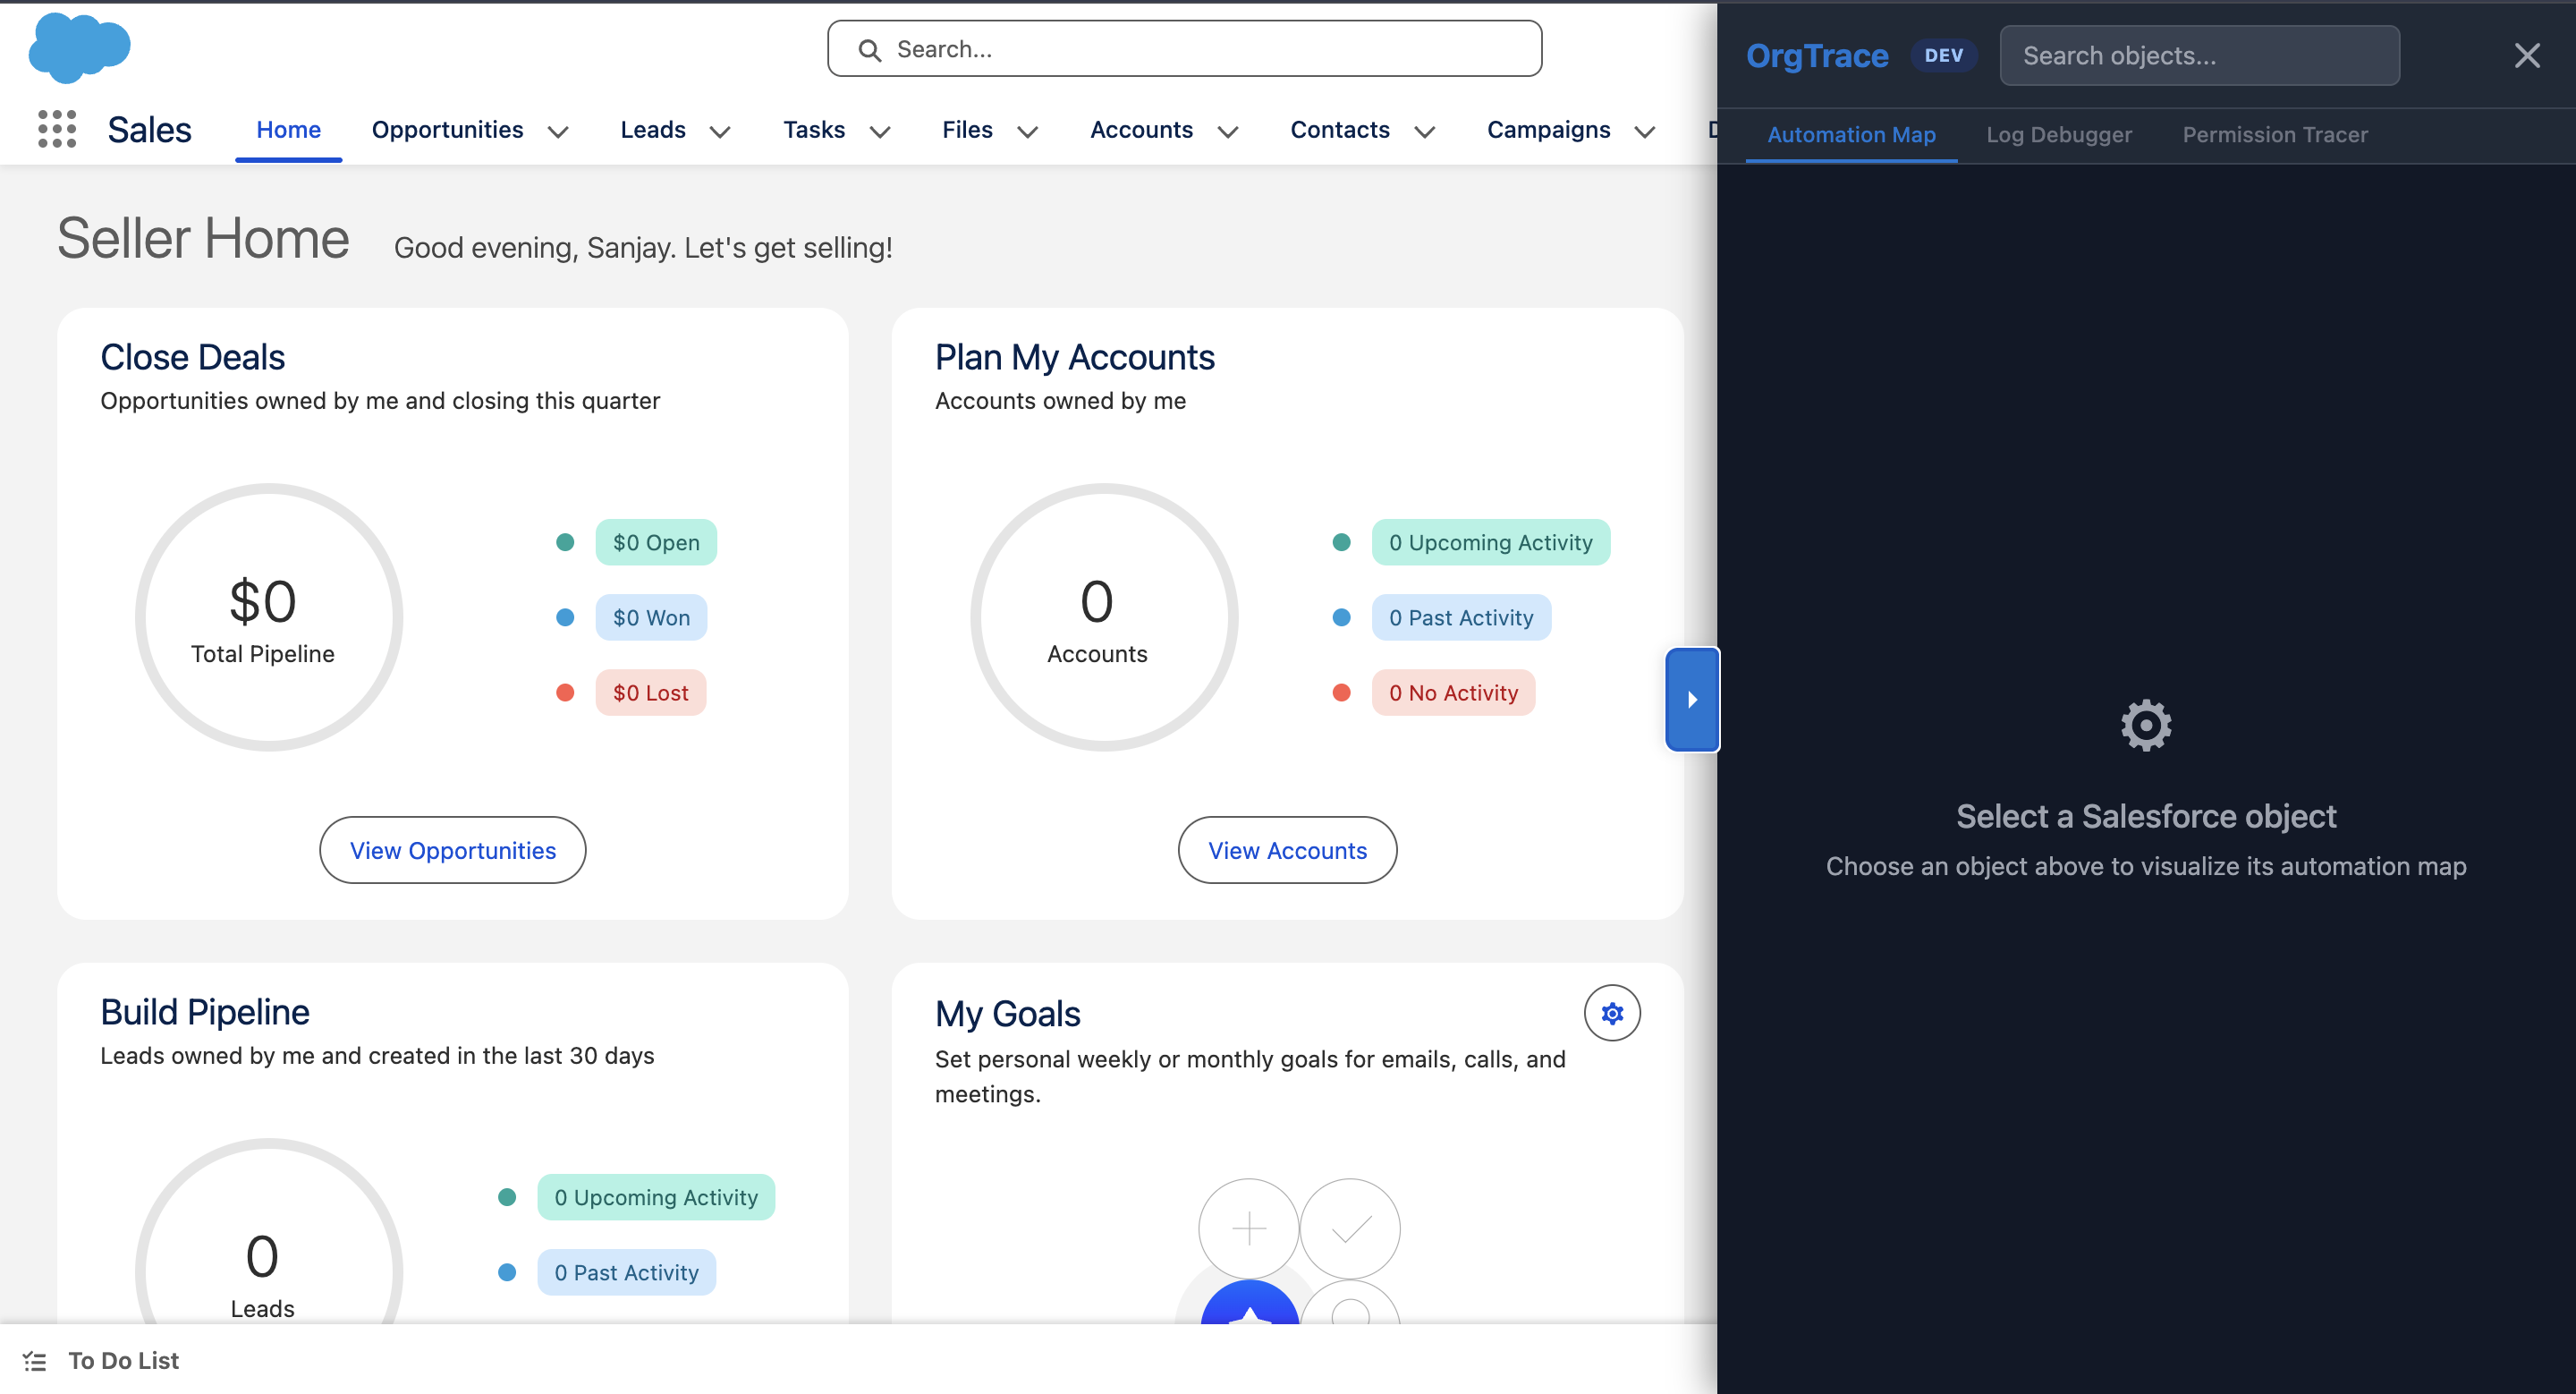
Everything you need to understand your org
Five tools, one extension — no account required, no data leaves your browser.
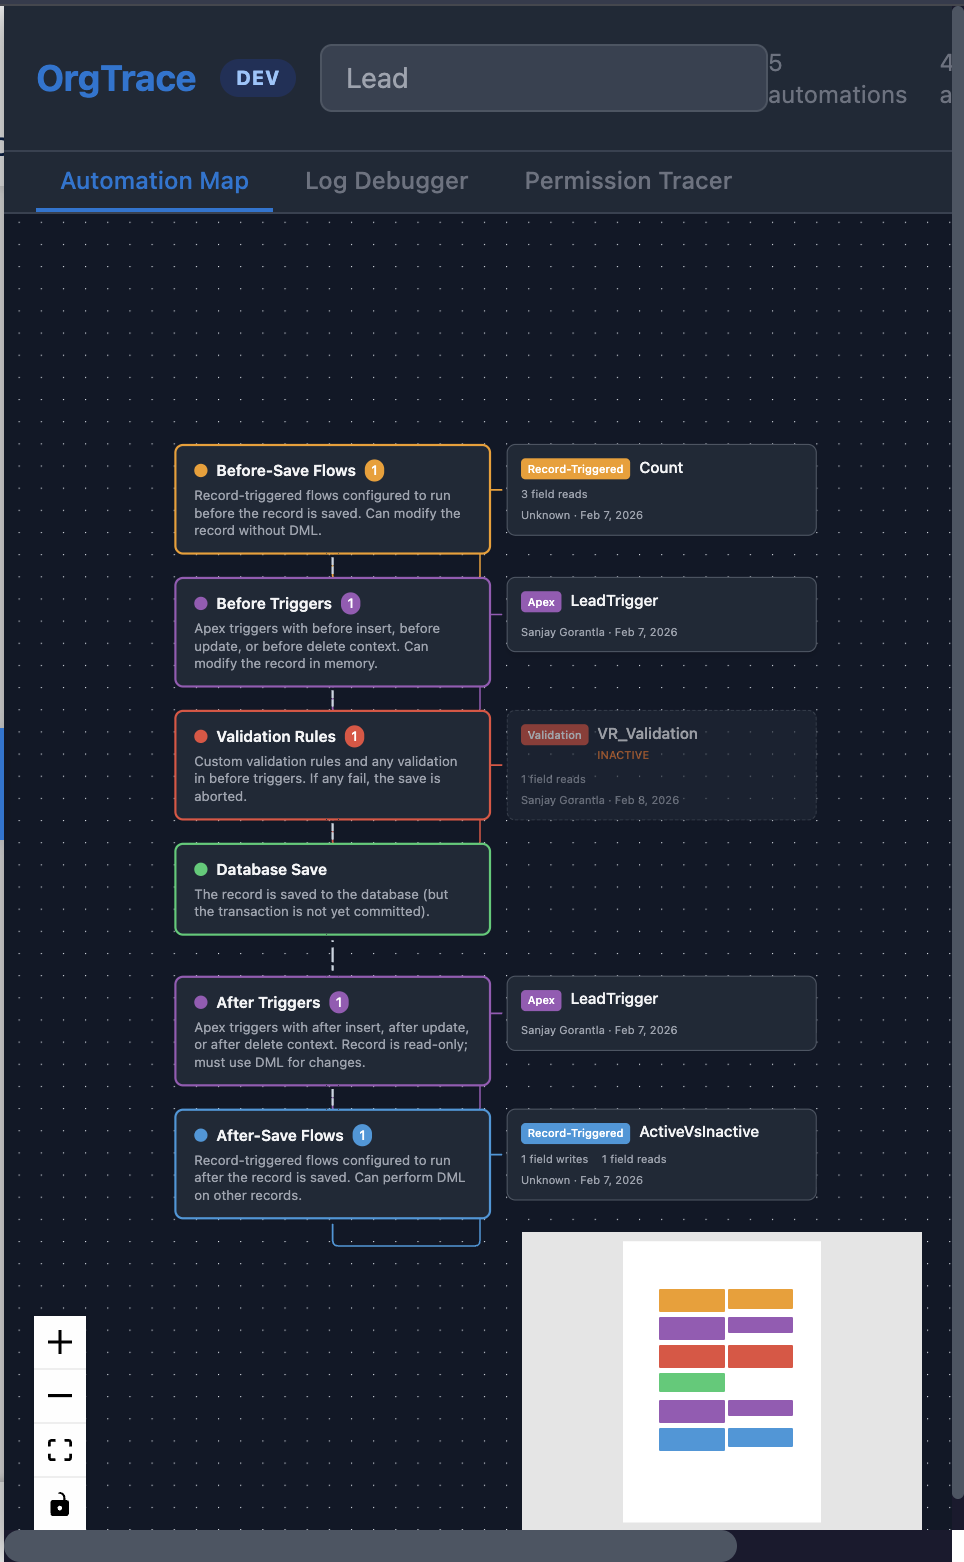
Automation Map
Every Flow, Trigger, Validation Rule, and Workflow Rule mapped to Salesforce's 16 execution phases — with conflict detection, health warnings, subflow expansion, cross-object chain detection, flow version history, and Apex test coverage badges.
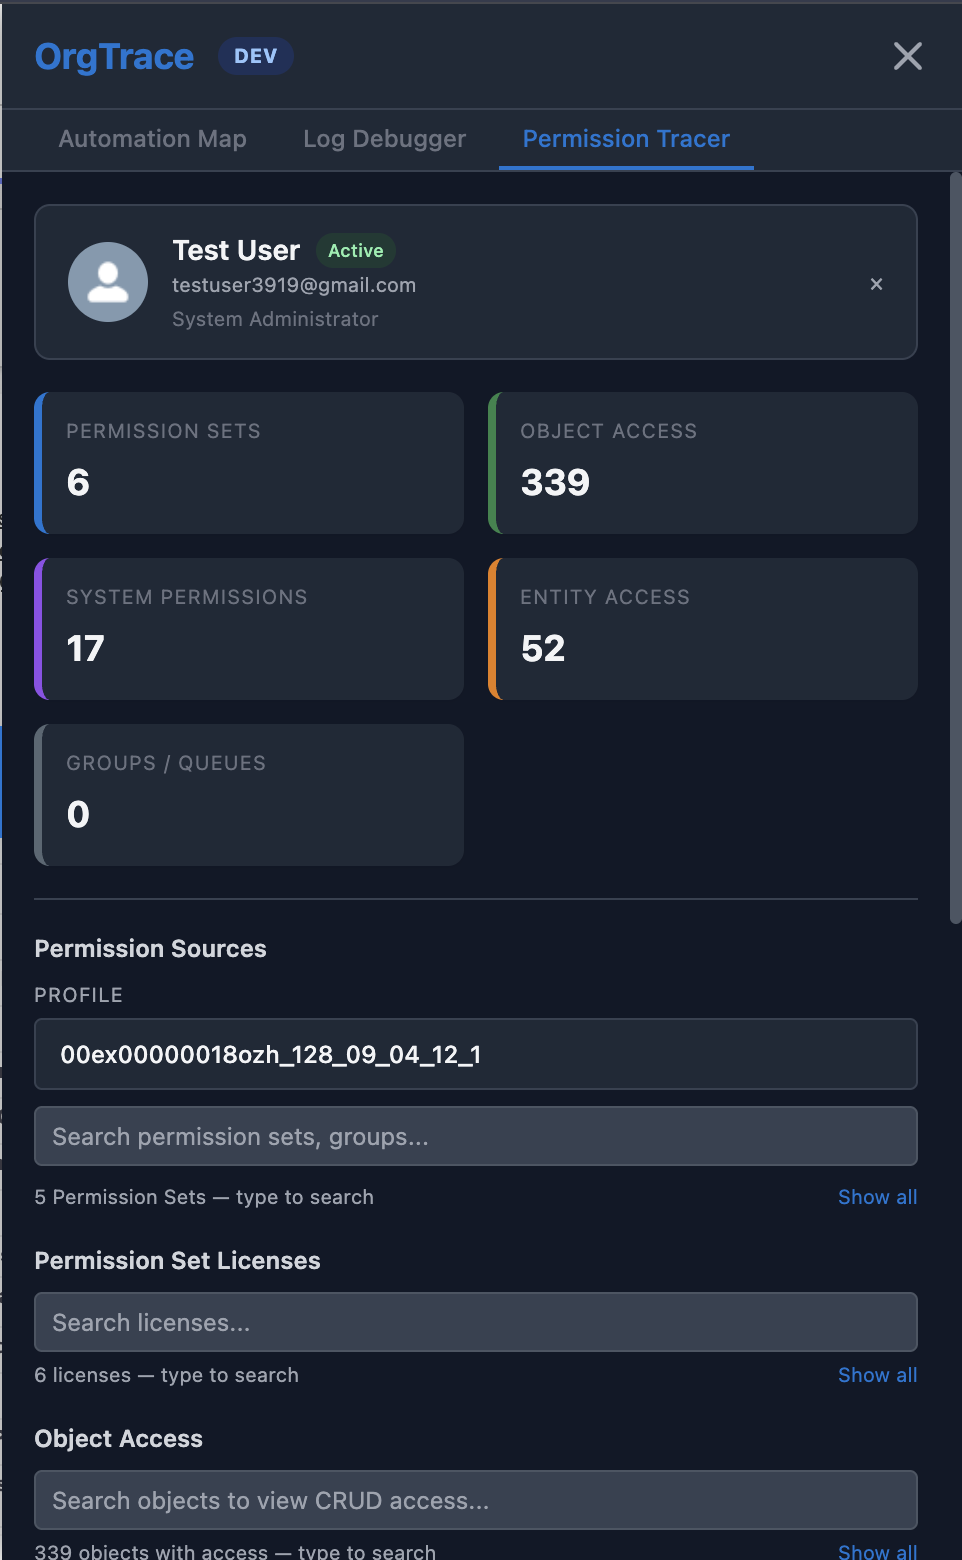
Permission Tracer
Trace any user's effective permissions — object CRUD, FLS, system permissions, role hierarchy, and more. Includes org-wide sharing model viewer, 90-day permission change history, profile → permission set migration analysis, reverse permission lookup, quick access checks, and side-by-side user diffs.
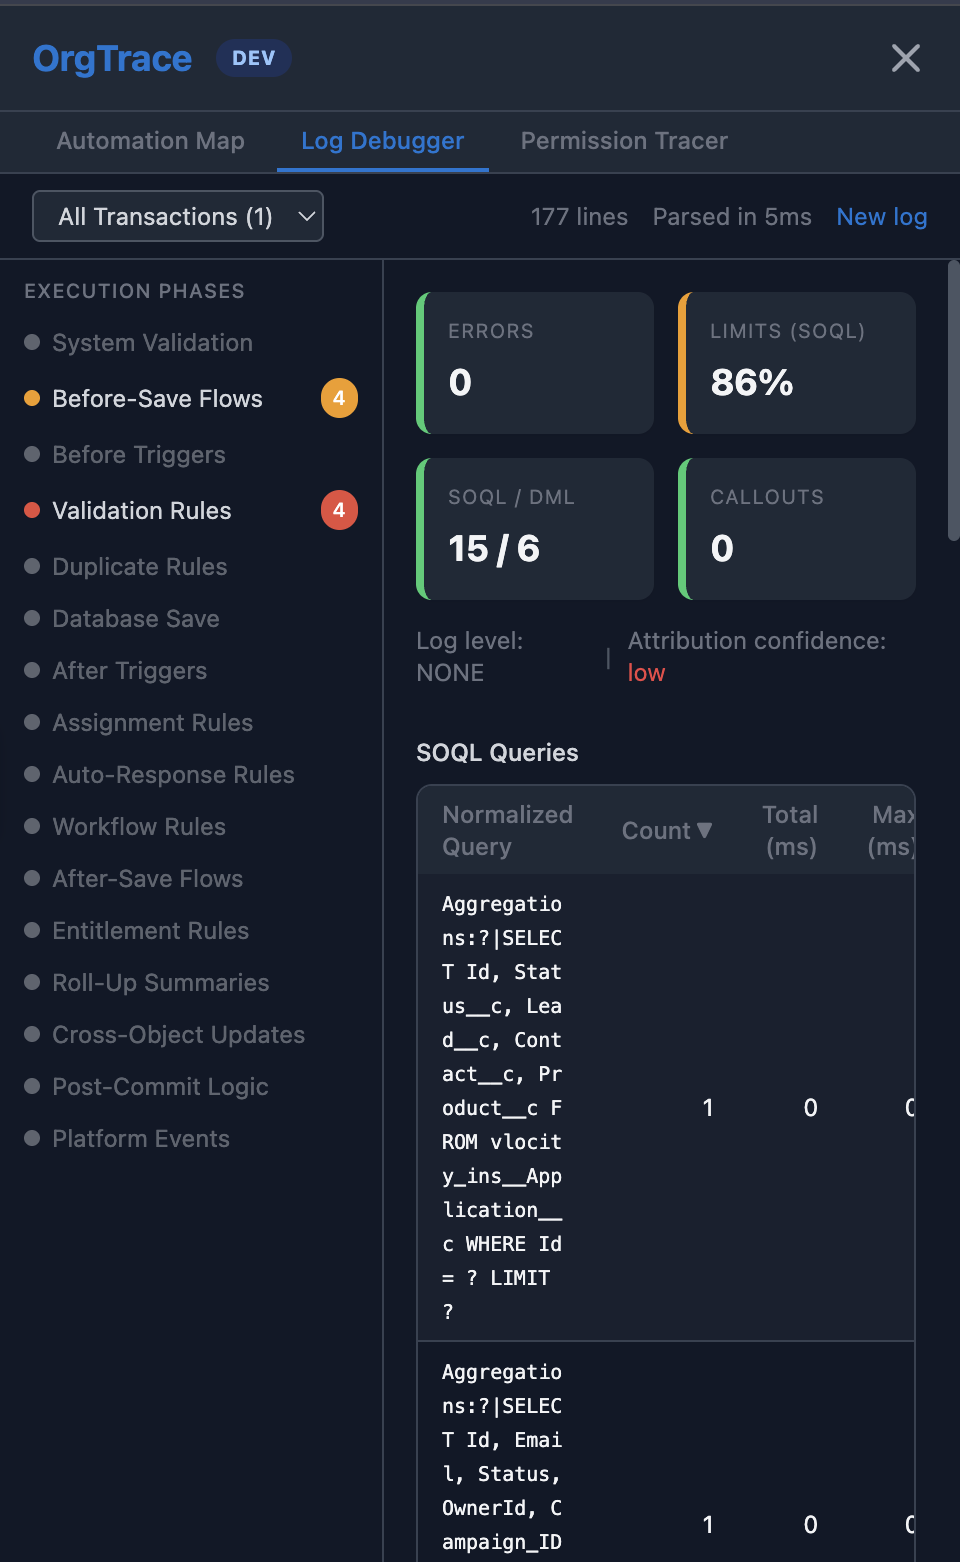
Log Debugger
Upload debug logs for instant analysis — governor limit tracking with per-automation attribution, SOQL aggregation with inline explain plans, execution flame chart, async execution chain tracing across transaction boundaries, and a built-in trace flag manager.
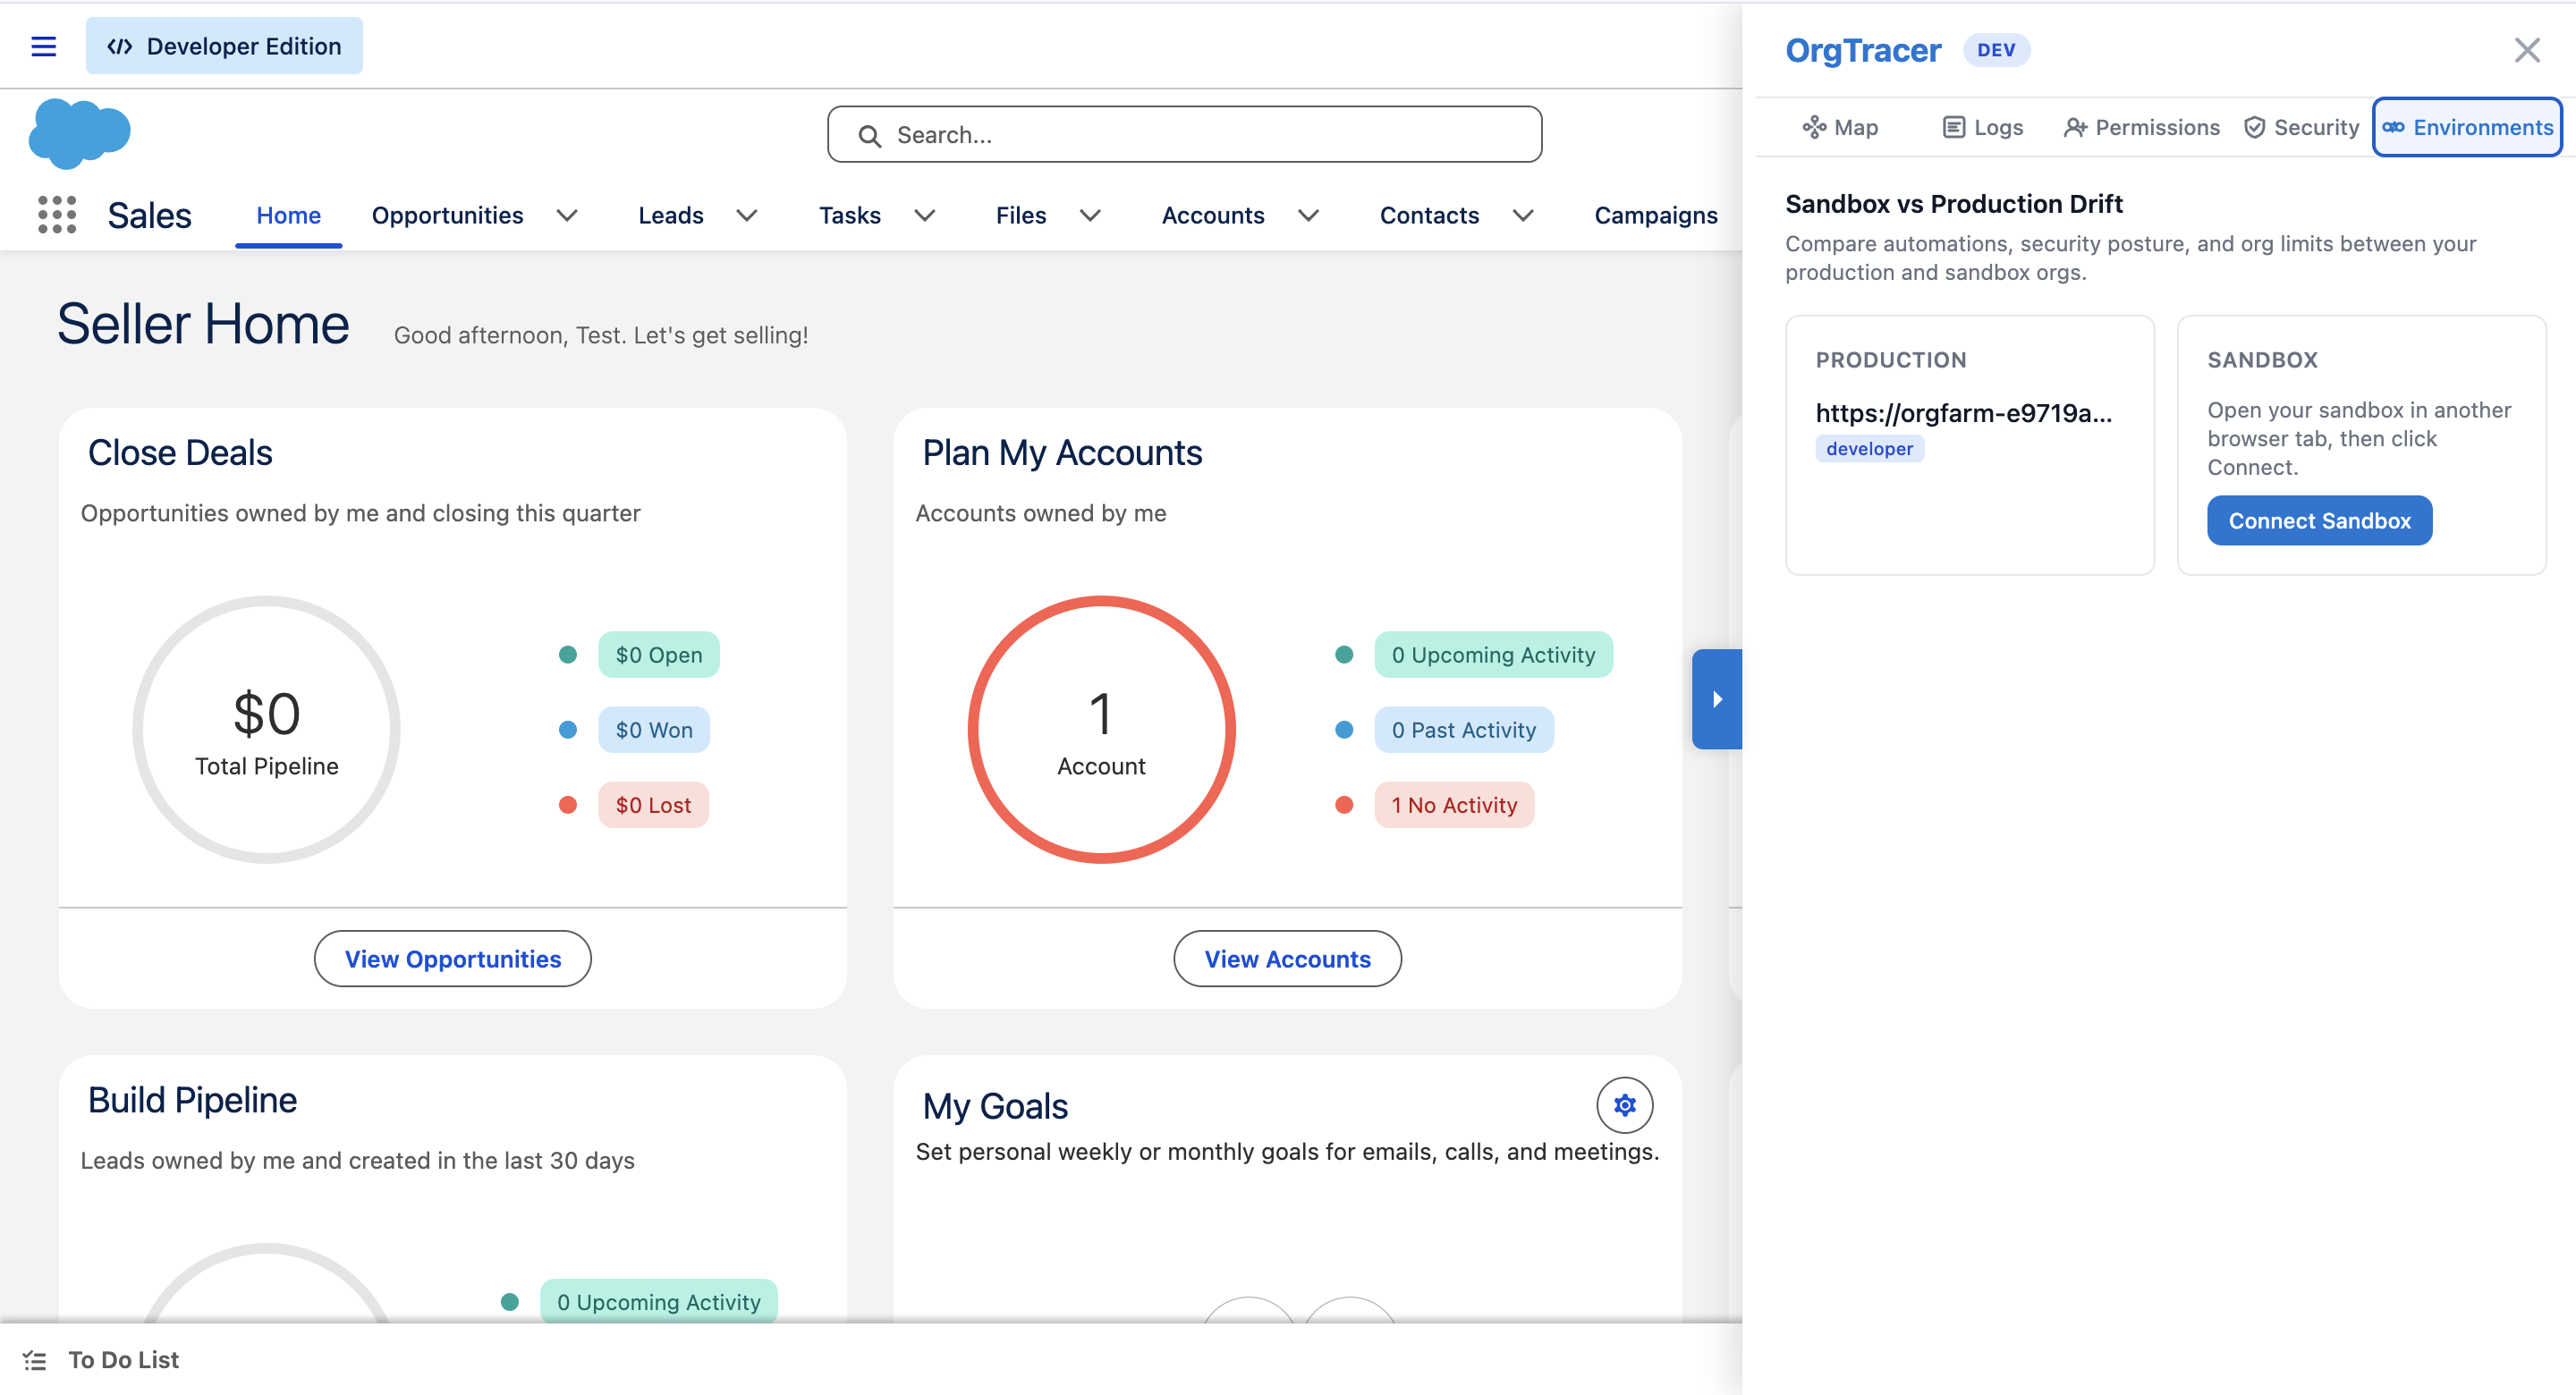
Environments
Connect your production and sandbox side by side. See which automations exist in one org but not the other, compare security scores and findings, and spot org limits that have drifted more than 10 points between environments.
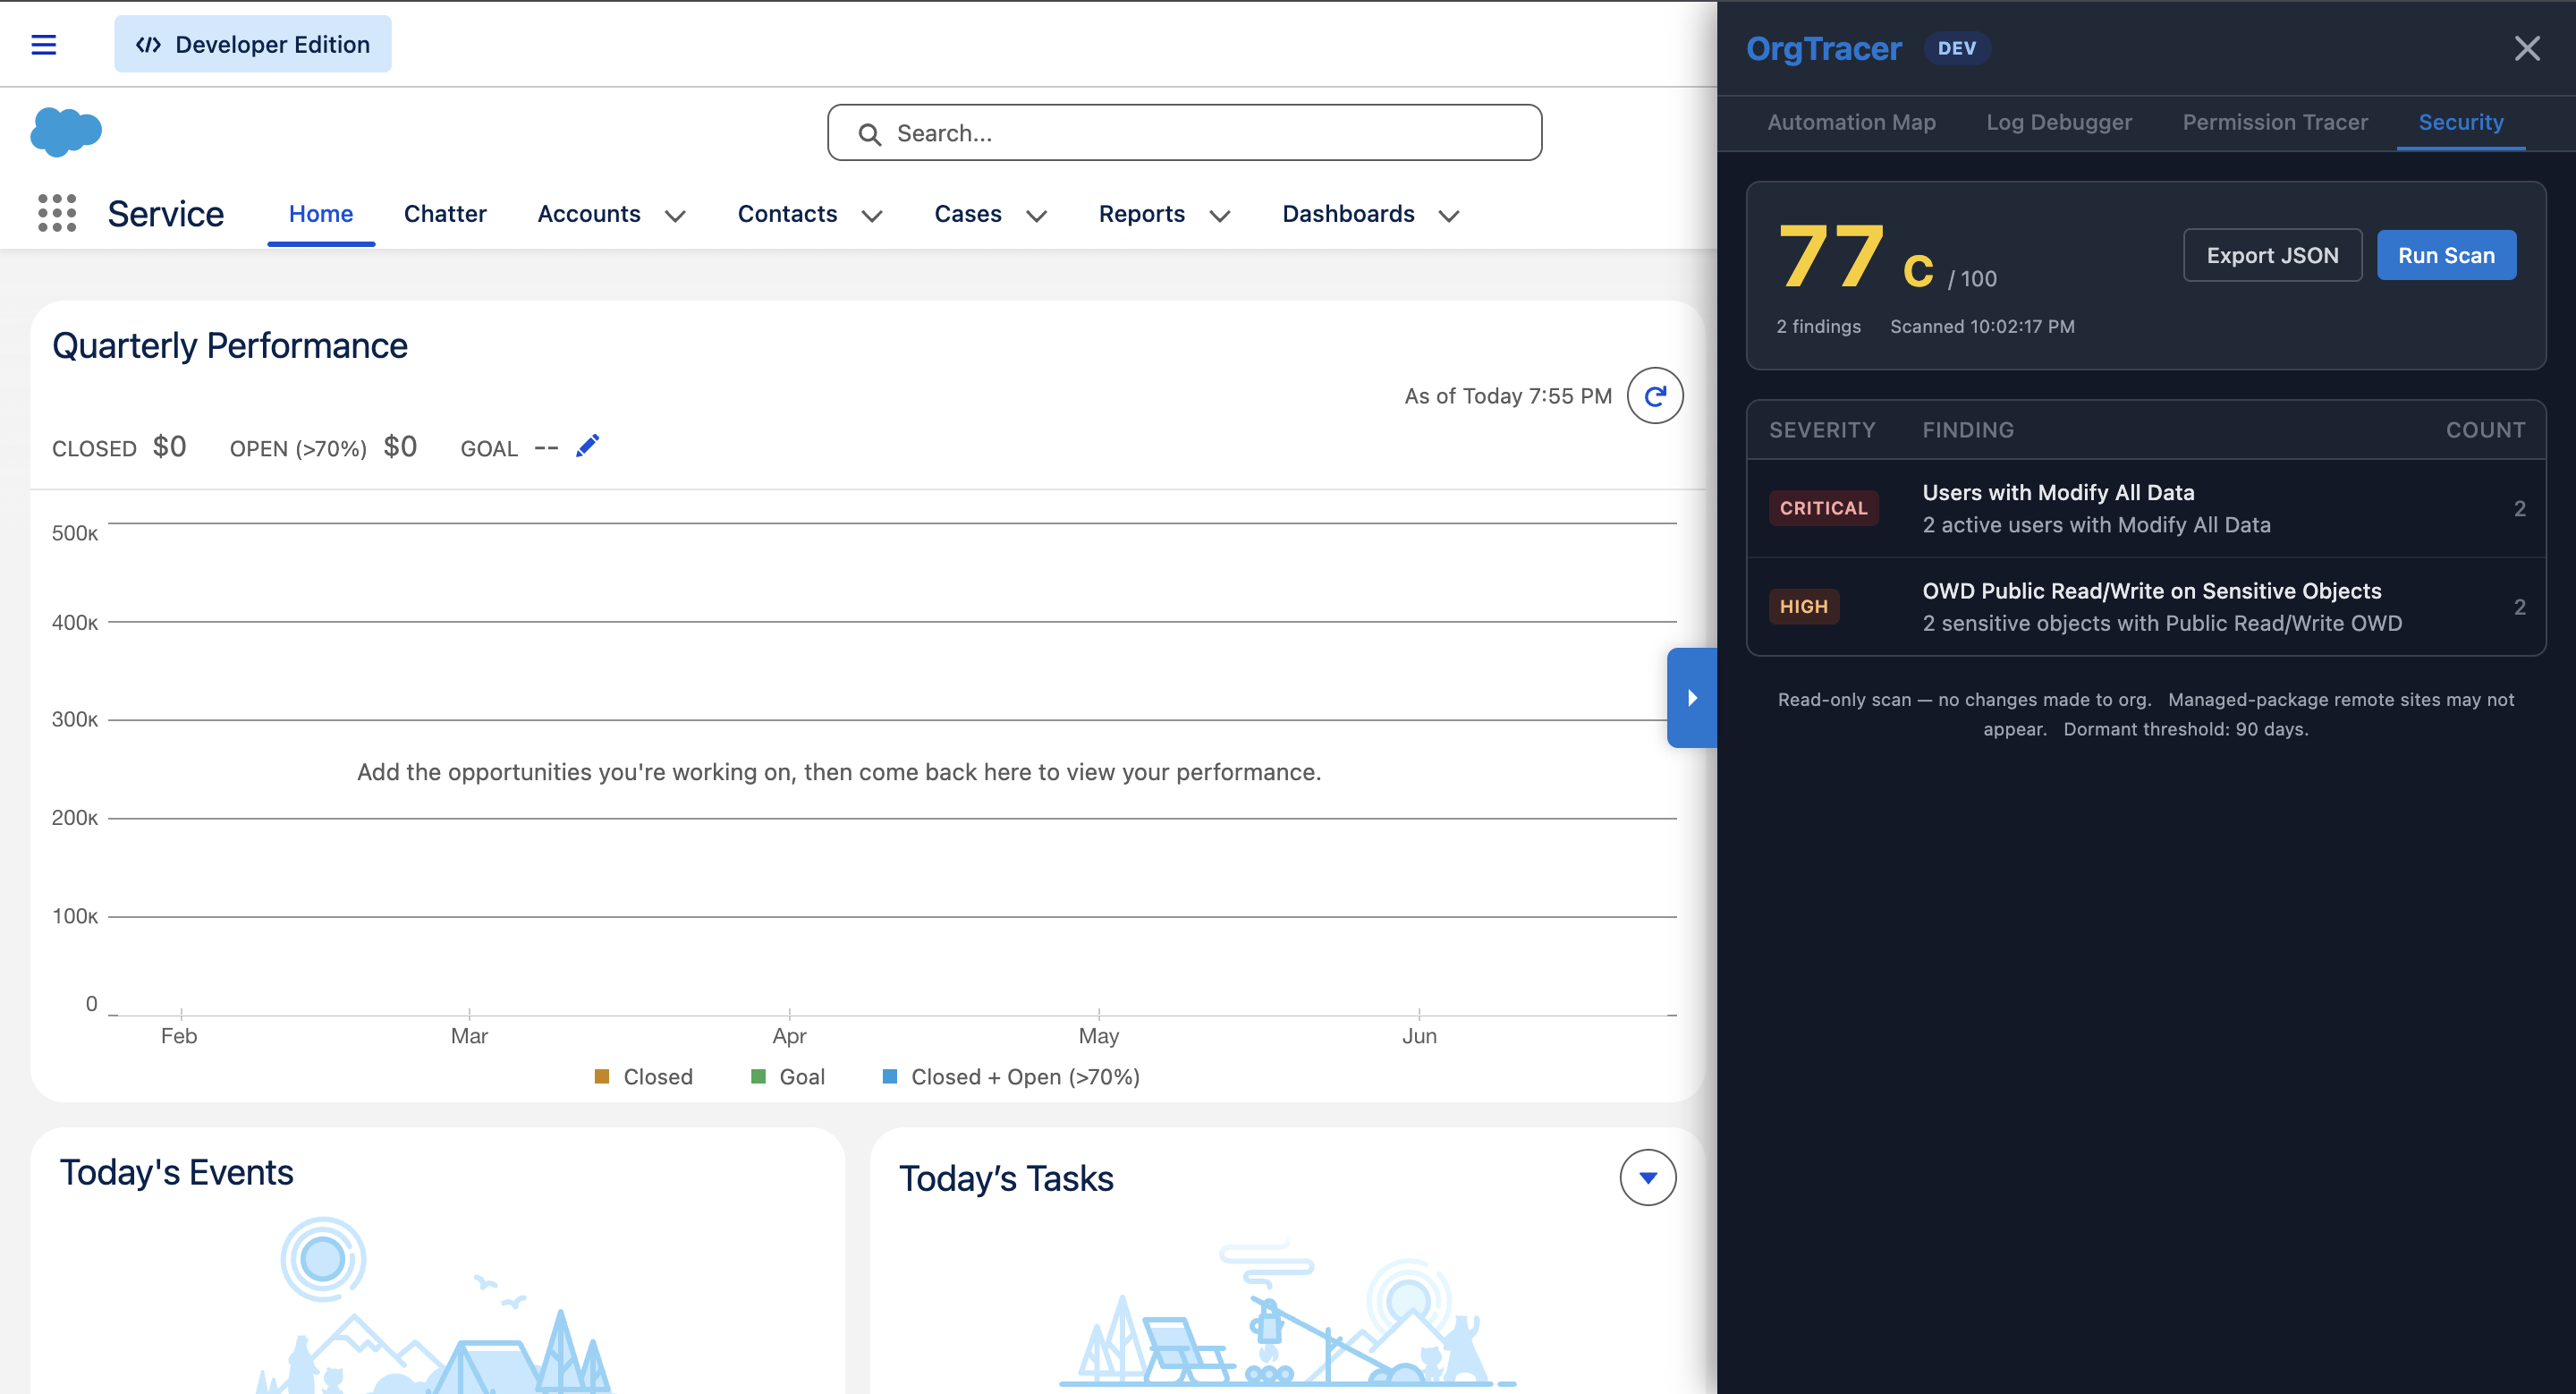
Security Auditor
Scan your org's security posture — flag Modify All Data users, dormant admins, guest user exposure, and misconfigured OWDs. Includes an Agentforce readiness score, live org API limits dashboard, and setup audit trail.
Go deeper with advanced features
Built for teams who need more than a surface-level view of their org — and for the ones getting ready for Agentforce.
Flow Version History
Click any Flow node to see how many versions exist, the current version number, last modified date, and who made the change — without leaving the panel.
Automation Health Badges
Instantly spot risky patterns: DML inside loops, missing fault paths, triggers with no recursion guard, and automations that haven't been touched in over two years.
Cross-Object Automation Chaining
See when a Flow or Trigger writes to a different object — detected from flow metadata, subflow chains up to 3 levels deep, and invocable Apex class analysis.
User Permission Diff
Select two users and compare their permissions side-by-side — object CRUD, system permissions, and perm sets — with color-coded rows highlighting every difference.
Agentforce Readiness Score
Instantly know if your org is ready for Agentforce — cross-references automation conflicts, security posture, and governor limit headroom into a single AI Ready / Needs Attention / At Risk verdict.
Profile → Permission Set Migration
Salesforce is deprecating profiles. See exactly which system permissions and object access your profile grants, which standalone permission sets already cover them, and what gaps remain — before you migrate.
SOQL Explain Plan Inline
Click any SOQL query in the Log Debugger to fetch its query plan — see relative cost, leading operation type (Index vs TableScan), cardinality, and optimizer notes without leaving the panel.
Execution Flame Chart
After parsing a debug log, see every Apex class, Flow, and Trigger as a proportional horizontal bar — color-coded by type, nested by call depth, with hover details for duration and start offset.
Apex Code Coverage Badges
See test coverage directly on Apex Trigger nodes in the Automation Map — green ≥75%, amber 50–74%, red below 50%. Click the node to see which specific lines are uncovered, scoped to the object you're inspecting.
Async Execution Lineage
Trace async chains across transaction boundaries — Future methods, Queueables, and Platform Events linked back to their originating transaction. See which leg consumed which governor limits. No other browser tool does this.
Execution Tree
See your debug log as a collapsible call tree — every Apex method, Flow, and Trigger nested by call depth, with SOQL and DML counts attributed to the frame that triggered them. Pairs with the flame chart for full execution context.
Org Sharing Model Viewer
See the internal and external org-wide defaults for every object in your org at a glance — filter by name, toggle to private-only to spot overly open OWDs instantly. Cached per org so it loads once.
Permission Drift Report
See how a user's permissions changed over the last 90 days — perm sets added or removed, profile changes, and user updates pulled from SetupAuditTrail and filtered to the selected user. Lazy-loads on demand, cached per user.
Sandbox vs Production Drift
Open your sandbox in a second browser tab and connect it to OrgTracer. Get a side-by-side diff showing which automations exist only in prod, only in sandbox, your security score gap, and limit usage deltas — without leaving the browser.
How OrgTracer compares
SF Inspector is the go-to for record editing. OrgTracer is built for understanding how your org actually works.
| Feature | OrgTracer | SF Inspector Reloaded |
|---|---|---|
| Automation execution map | ✓ | — |
| Async execution chain tracing | ✓ | — |
| Per-automation governor limit attribution | ✓ | — |
| Permission tracing with source attribution | ✓ | Partial |
| Profile → Permission Set migration analysis | ✓ | — |
| SOQL explain plan inline | ✓ | — |
| Security audit + org posture score | ✓ | — |
| Sandbox vs production drift detection | ✓ | — |
| Agentforce readiness score | ✓ | — |
| Debug log analysis | ✓ | Basic |
| Record create / edit / delete | — | ✓ |
| Anonymous Apex execution | — | ✓ |
| Free | ✓ | ✓ |
| No data collection | ✓ | ✓ |
Privacy-First Design
No data collection. No analytics. No external servers. Everything runs in your browser. Your Salesforce data never leaves the direct connection between your browser and your org.
Frequently asked questions
Does it modify my org?
Almost never. The one exception is the Trace Flag manager in the Log Debugger, which can create or delete a TraceFlag record so you can capture a debug log — and only when you explicitly click the button. Every other feature (Automation Map, Permission Tracer, Security Auditor, Environments) is purely read-only.
Do I need a Connected App or any setup?
No setup required for most orgs. OrgTracer reads your active Salesforce session cookie — the same approach used by SF Inspector. A Connected App is only needed if your org has API Access Control enabled, and even then it takes about two minutes to configure on the Options page.
Does my Salesforce data leave my browser?
Never. Every API call goes directly from your browser to your Salesforce org. There are no intermediate servers, no analytics trackers, and no data collection of any kind. The extension has no backend.
Which Salesforce profiles or roles can use it?
Any user who can log in. System Admins see everything. Non-admin users see exactly what their permissions allow — OrgTracer makes Salesforce API calls on your behalf, so the same field and object security applies.